Food VAT Burden Index
I got pissed off that food is expensive in Estonia, so I dug into the numbers.
The thing that bothered me wasn't just the price on the shelf. It was the price in relation to what people earn. "It's expensive in Denmark too" doesn't tell me very much if the person in Denmark has a completely different salary.
And then there's the government's part of the bill. So I made a small comparison of food VAT and income across the EU, and called it the Food VAT Burden Index. A slightly grand name for a fairly simple calculation, but it let me look at the question I actually cared about.
What I was comparing
The calculation in the original document is:
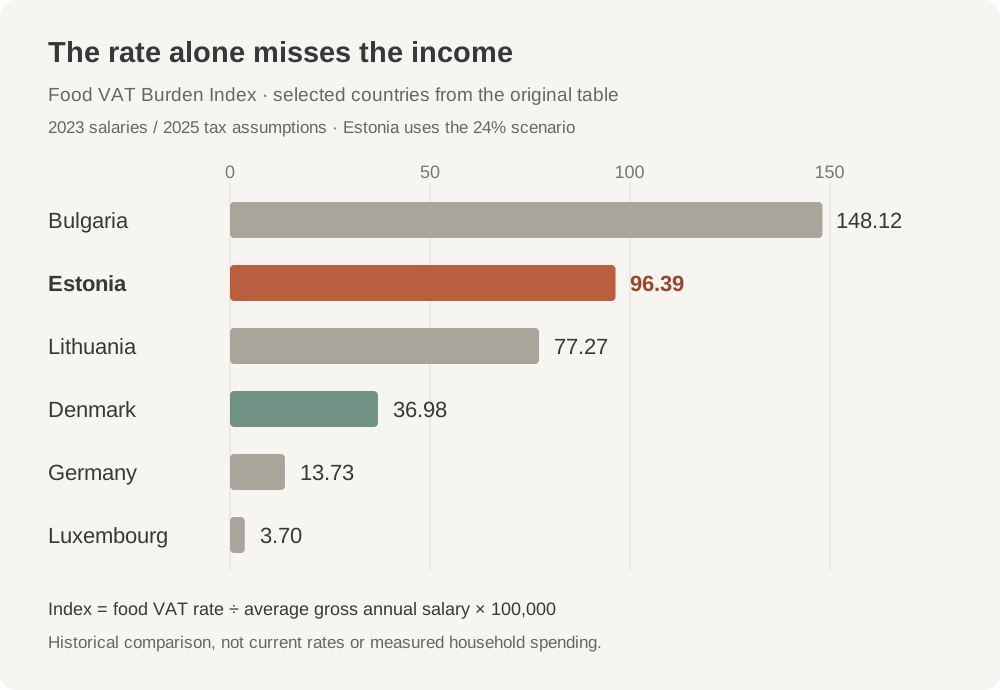
Food VAT rate ÷ average gross annual salary × 100,000.
You enter the tax rate as a number like 24, not 0.24. The multiplier just makes the results easier to read. It doesn't turn them into an actual percentage of someone's earnings.
Higher tax pushes the score up. Higher income pushes it down. That's the whole idea. If two countries charge the same rate but one has much lower earnings, a comparison of the rates alone misses something fairly obvious about the people paying them.
The original table used 2023 salary data and 2025 tax rates or assumptions. It put Estonia second, behind Bulgaria, using 24% for Estonia. This is an archive of that comparison, not a live ranking of today's tax systems.
Denmark was the useful comparison
In that table Denmark had a food VAT rate of 25%, compared with Estonia's 24%. If you stop there, Denmark looks slightly worse.
But the salary figures were €67,604 for Denmark and €24,899 for Estonia. Put those into the calculation and Denmark comes out at 36.98, while Estonia comes out at 96.39.
That's the point I was trying to make. You can have a higher headline tax rate and a much lower score once income is in the picture. The tax percentage isn't the whole argument.
It also explains why I didn't just make a list of the cheapest places to buy groceries. That's a different question. This was an attempt to isolate one piece of why the bill feels so unreasonable relative to local earnings.
What the index doesn't tell you
It doesn't include an actual shopping basket. It doesn't include how much of a household's income goes on food. It uses average gross earnings, which is obviously different from the amount a particular family takes home.
And "food VAT" is messier than one number per country. The original document's own footnotes point out the problem with Ireland: many staples were zero-rated, while the table used a different food-related rate. Which products you choose changes the comparison. There are also old current/future labels left in the document from Estonia's rate change.
So I wouldn't treat the precise ranking as the final word on food affordability. To do that properly you'd need a consistent basket, comparable take-home incomes, and a careful pass through the different rates. This was a first pass at a narrower question.
My broader frustration is still there. Selection, quality, imports, distribution, and retail margins all affect what ends up on a shelf and what it costs. This calculation doesn't establish which of those is responsible, or prove every opinion I have about shopping in Estonia. It just gives one part of the discussion something more concrete than me complaining.
And then I did it with fuel
The same question came up again with petrol and diesel: expensive compared with what income? That became the EU Fuel Price & Burden Index, which has an interactive map and a different calculation based on annual fuel use and net salary.
The two indices aren't interchangeable. But they came from the same irritation with comparing prices as if everyone's starting from the same place.
The full food VAT analysis has the table and its footnotes. You can decide how much weight to put on it. I think the question is worth asking even if my first version of the answer needs work.